Cesium map
MetacatUI uses CesiumJS to create map visualization sections in Portals and in the Catalog Search. This guide summarizes the models, views, and collections that create and control the Cesium widget and the surrounding UI.
For information on how to configure the Cesium map in portals, see Cesium map for Portals.
For information on how to configure the Cesium map in the Catalog Search, see Catalog Search View Guide.
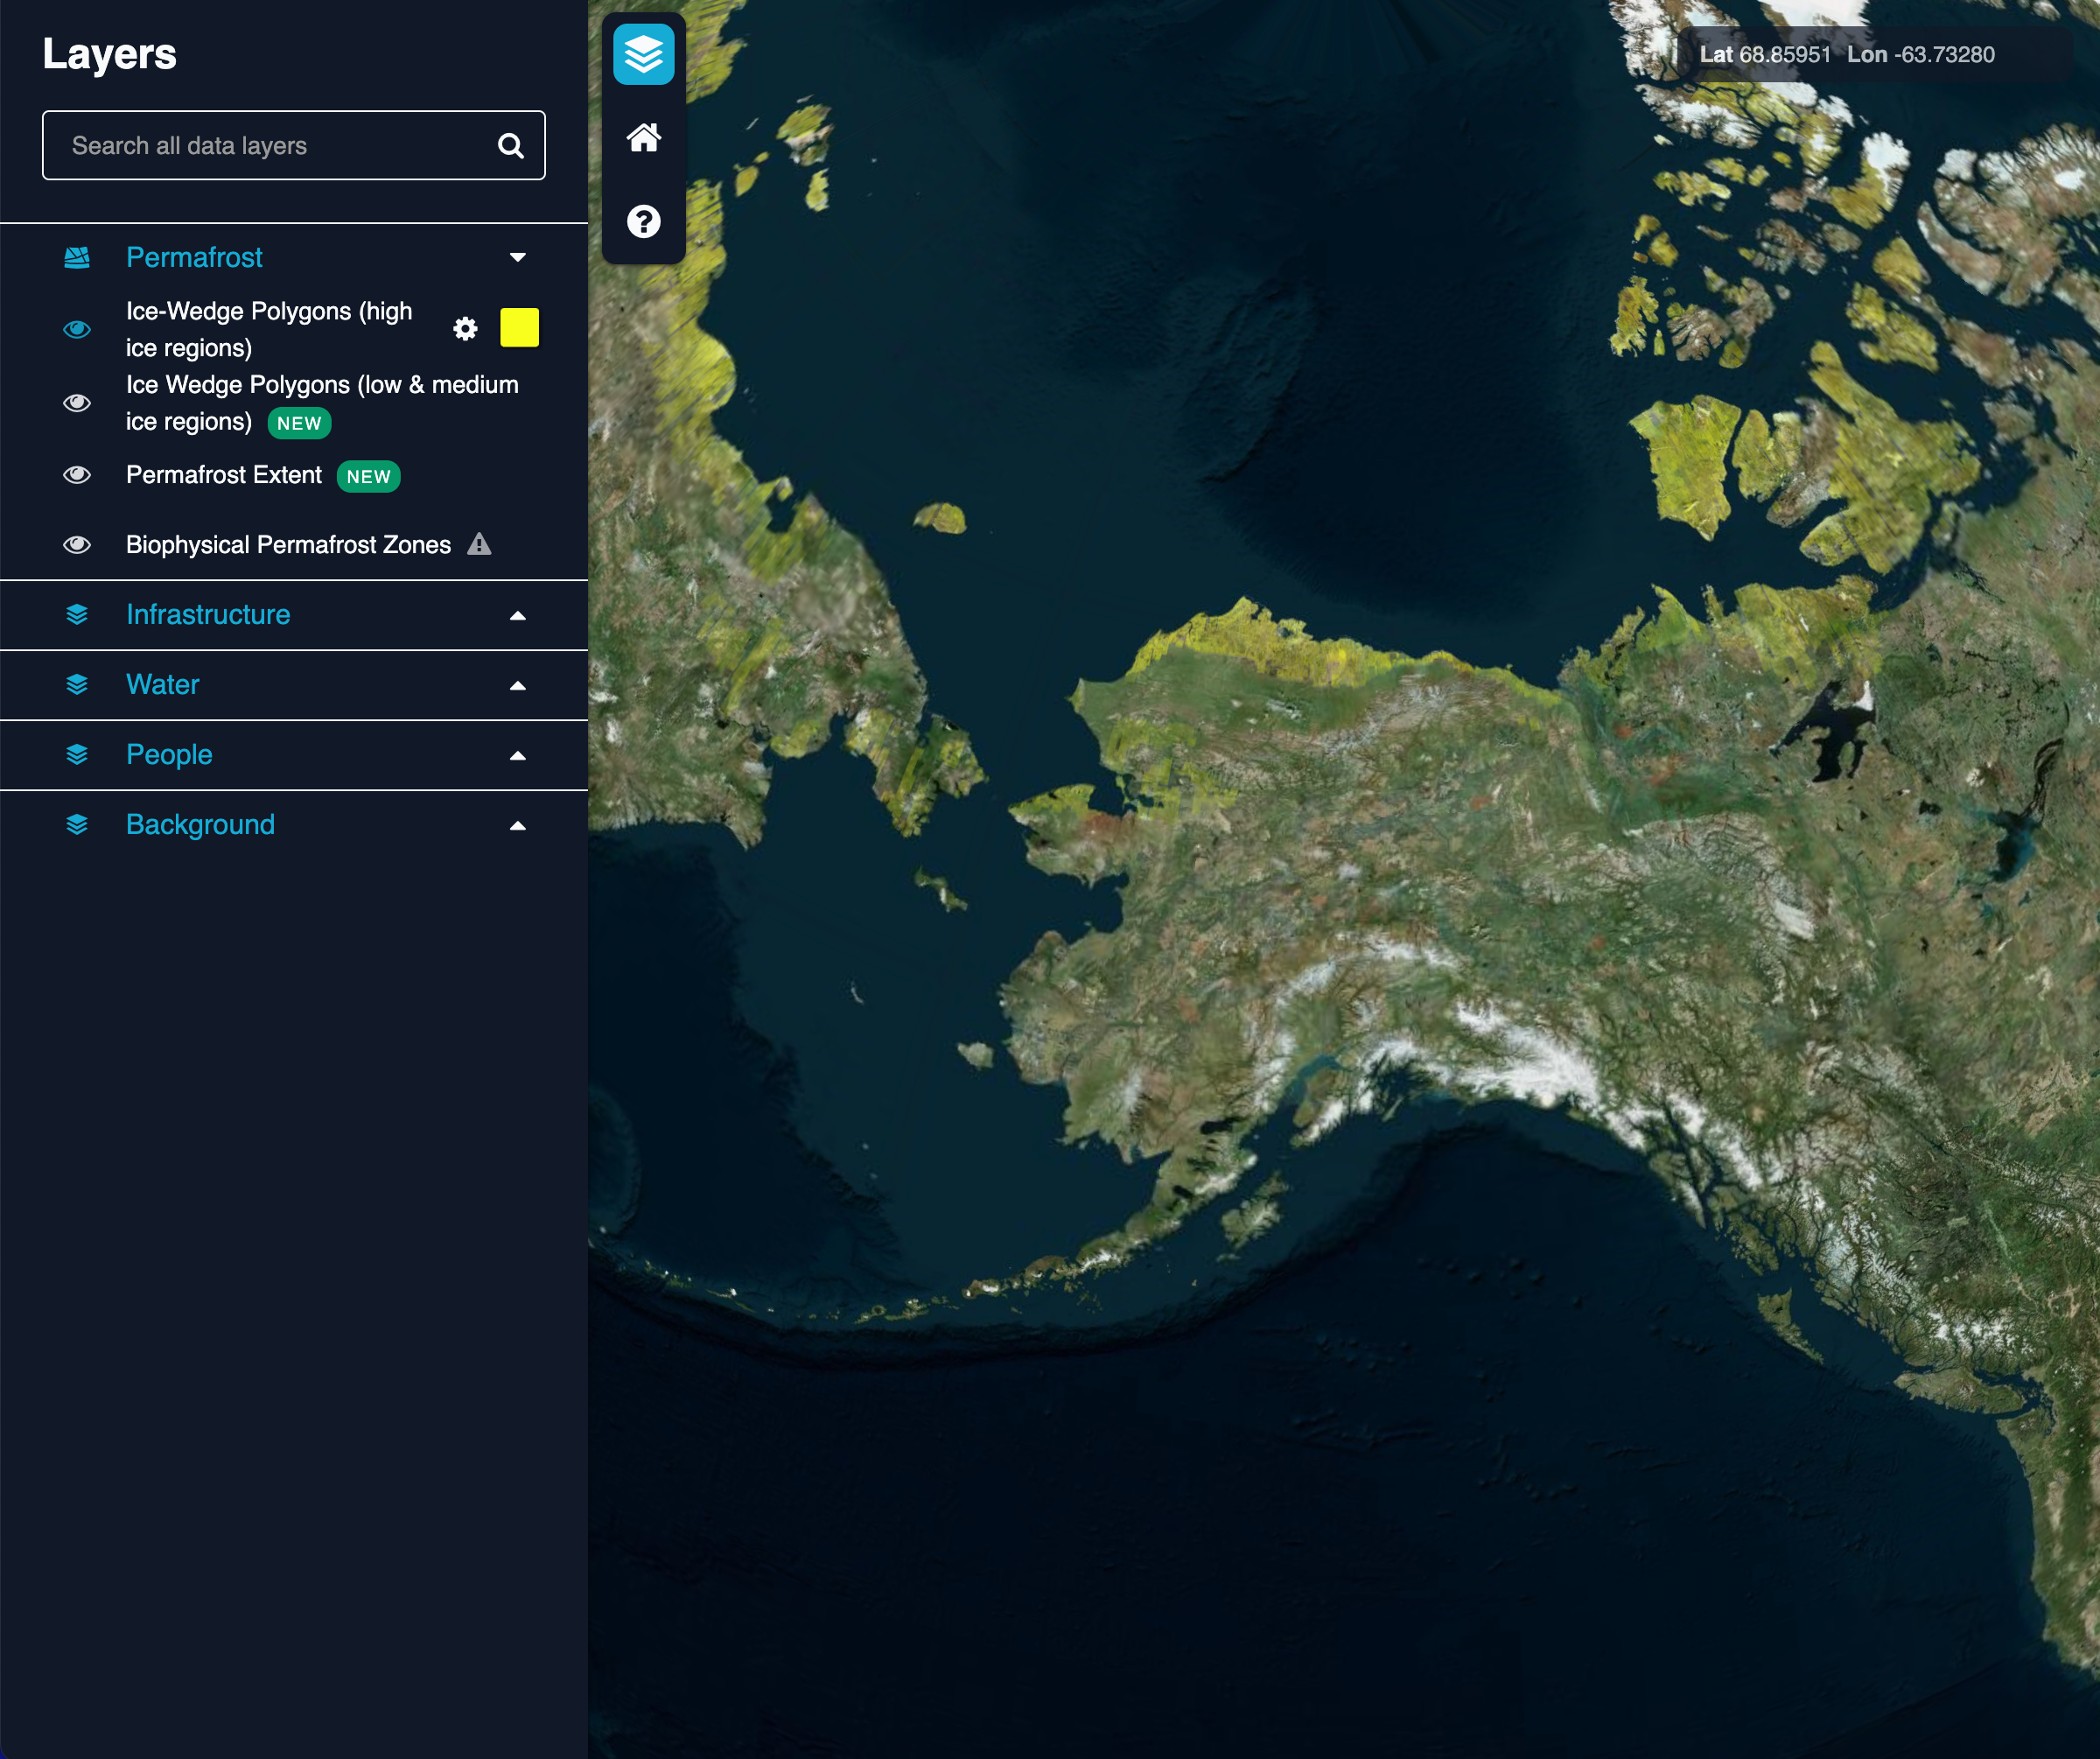
MapView, which uses the CesiumJS libraryEnabling Cesium
To enable Cesium for portals and/or for the data catalog, set the enableCesium property to true in your configuration file. To enable displaying layers from Cesium Ion in maps, the cesiumToken property must also be set to a Cesium Ion token. Sign up for a token here. This is optional, and by default, NaturalEarthII imagery will be displayed, even without a Cesium token.
Configuration
When a new Map model is created, an object with configuration options can be passed to the model, e.g. var myMapModel = new Map(MapConfig).
The MapConfig object specifies the source of layer and terrain data to show on the map (and properties of these assets), whether UI elements like the toolbar and scalebar are rendered, and the location the map should display initially.
Complete documentation for the map configuration can be found in the API docs MapConfig section.
Minimal example
No configuration is required to render a Cesium map, but with no config options specified, only an empty blue sphere representing the Earth in space will be rendered, along with a scalebar and a toolbar with an empty layer list. In the minimal example below, satellite imagery is rendered directly from Bing maps (thus a Cesium token is not required), and all of the extra UI elements are not rendered. The map will be positioned at the default location set in the MapModel.
{
  "layers": [
    {
      "label": "Satellite imagery",
      "icon": "urn:uuid:77d43f50-c947-4600-889a-73c714aba54b",
      "type": "BingMapsImageryProvider",
      "cesiumOptions": {
        "key": "someBingMapsAPIKeyHere",
        "url": "https://dev.virtualearth.net"
      }
    }
  ],
  "showToolbar": false,
  "showScaleBar": false,
  "showFeatureInfo": false
}
Detailed example
Below is an example of a detailed map configuration (descriptions have been shortened):
{
  "homePosition": {
    "heading": 356,
    "height": 15375560,
    "latitude": 84.23277,
    "longitude": -106.79526,
    "pitch": -89.83940540045835,
    "roll": 0
  },
  "layers": [
    {
      "label": "Ice Wedge Polygons",
      "icon": "urn:uuid:77d43f50-c947-4600-889a-73c714aba54b",
      "type": "Cesium3DTileset",
      "visible": true,
      "description": "Ice wedges form polygonal ice networks that enclose cells of frozen...",
      "cesiumOptions": {
        "ionAssetId": "634562"
      },
      "colorPalette": {
        "colors": [
          {
            "color": "#4fffb9"
          }
        ]
      }
    },
    {
      "label": "Surface Water",
      "icon": "urn:uuid:d31ccc09-bf4b-477c-b299-d64d710f470e",
      "type": "Cesium3DTileset",
      "description": "This sub-meter resolution surface water layer was derived from the high...",
      "attribution": "Kaiser S, Grosse G, Boike J, Langer M. Monitoring the Transformation of Arctic Landscapes: Automated Shoreline Change Detection of Lakes Using Very High Resolution Imagery. Remote Sensing. 2021; 13(14):2802. https://doi.org/10.3390/rs13142802",
      "moreInfoLink": "https://doi.org/10.3390/rs13142802",
      "cesiumOptions": {
        "ionAssetId": "634566"
      },
      "colorPalette": {
        "colors": [
          {
            "color": "#33b1ff"
          }
        ]
      },
      "filters": [
        {
          "filterType": "categorical",
          "property": "year",
          "values": [2021],
          "allValues": [2019, 2020, 2021]
        }
      ]
    },
    {
      "label": "Lakes",
      "icon": "urn:uuid:d31ccc09-bf4b-477c-b299-d64d710f470e",
      "type": "Cesium3DTileset",
      "description": "The data quantify the abundance and distribution of...",
      "moreInfoLink": "https://doi.pangaea.de/10.1594/PANGAEA.922808",
      "downloadLink": "https://apgc.awi.de/dataset?tags=Lakes&product=Permafrost+Region+Disturbance&tags=Landsat",
      "attribution": "Nitze, Ingmar; Grosse, Guido; Jones, Benjamin M; Romanovsky, Vladimir E; Boike, Julia (2018): Remote sensing quantifies widespread abundance of permafrost region disturbances across the Arctic and Subarctic, Datasets. PANGAEA, https://doi.org/10.1594/PANGAEA.894755",
      "id": "https://doi.org/10.1594/PANGAEA.922808",
      "cesiumOptions": {
        "ionAssetId": "634564"
      },
      "colorPalette": {
        "paletteType": "categorical",
        "colors": [
          {
            "color": "#33b1ff"
          }
        ]
      }
    },
    {
      "label": "Biophysical Permafrost Zones",
      "icon": "urn:uuid:6277300f-d580-4a12-945d-aeb68ffab490",
      "type": "Cesium3DTileset",
      "visible": false,
      "opacity": 0.4,
      "description": "This biophysical permafrost zonation map was produced...",
      "moreInfoLink": "https://iopscience.iop.org/article/10.1088/1748-9326/ac20f3",
      "downloadLink": "https://doi.org/10.11888/Geocry.tpdc.271659",
      "attribution": "Y.Ran, Y.; M. Torre Jorgenson.; Li, X.; Jin, H.; Wu, T.; Li, R.; Cheng, G. (2021): A biophysical permafrost zonation map in the Northern Hemisphere (2000-2016). National Tibetan Plateau Data Center, https://doi.org/10.11888/Geocry.tpdc.271659",
      "cesiumOptions": {
        "ionAssetId": "634560"
      },
      "colorPalette": {
        "paletteType": "categorical",
        "property": "Type",
        "label": "Zone type",
        "colors": [
          {
            "value": "Climate-driven",
            "color": "#FF3720"
          },
          {
            "value": "Climate-driven/ecosystem-modified",
            "color": "#0370FE"
          },
          {
            "value": "Climate-driven/ecosystem protected",
            "color": "#BFD1FF"
          },
          {
            "value": "Ecosystem-driven",
            "color": "#4DE603"
          },
          {
            "value": "Ecosystem-protected",
            "color": "#267301"
          },
          {
            "color": "#ffffff"
          }
        ]
      }
    },
    {
      "label": "Satellite imagery",
      "icon": "urn:uuid:4177c2e1-3037-4964-bf00-5f13182308d9",
      "type": "IonImageryProvider",
      "description": "Global satellite imagery down to 15 cm resolution in urban areas",
      "attribution": "Data provided by Bing Maps © 2021 Microsoft Corporation",
      "moreInfoLink": "https://www.microsoft.com/maps",
      "cesiumOptions": {
        "ionAssetId": "2"
      }
    },
    {
      "label": "Some Test GeoJSON",
      "type": "GeoJsonDataSource",
      "description": "A single point specified using GeoJSON",
      "customProperties": {
        "year": {
          "type": "date",
          "property": "dateAndTime",
          "format": "YYYY"
        }
      },
      "featureTemplate": {
        "template": "story",
        "label": "year",
        "options": {
          "description": "summary"
        }
      },
      "cesiumOptions": {
        "data": {
          "type": "FeatureCollection",
          "features": [
            {
              "type": "Feature",
              "geometry": {
                "type": "Point",
                "coordinates": [102.0, 0.5]
              },
              "properties": {
                "prop0": "value0",
                "dateAndTime": "2007-03-01T13:00:00Z",
                "summary": "This is an example point!"
              }
            }
          ]
        }
      }
    }
  ],
  "terrains": [
    {
      "label": "Arctic DEM",
      "type": "CesiumTerrainProvider",
      "cesiumOptions": {
        "ionAssetId": "3956",
        "requestVertexNormals": true
      }
    }
  ],
  "showToolbar": true,
  "showScaleBar": true,
  "showFeatureInfo": true
}
Views, models & collections
In the API Docs, views, models, and collections for the map are categorized under Views/Maps , Models/Maps , Collections/Maps , respectively. Models that contain information about map layers and terrain data are further grouped under Models/Maps/Assets .
Views
Generally, the Map views are organized such that the CesiumWidgetView could be easily interchanged with some other map widget: The UI views like the LayerDetailsView , ScalebarView , etc., receive data from and send updates to the Map models independent of the CesiumWidgetView . For example, rather than Cesium directly updating the longitude and latitude in the scaleBarView, it instead updates the Map model’s currentPosition attribute. The MapView listens to changes in Map ‘s currentPosition and then updates the ScaleBarView accordingly. If in the future the CesiumWidgetView is replaced with a new map widget, it would simply need to update the Map.currentPosition attribute and the ScaleBarView would work as it did before.

Models & collections
All layer and and terrain models are extensions of the more generic MapAsset model, which comprises attributes that are common to most of the layer/terrain models. As with the views, models and collections are designed to be as independent from the Cesium widget as possible, with the exception of some of the terrain and layer models.
Cesium asset models
The Cesium3DTileset , CesiumVectorData , CesiumImagery , and CesiumTerrain asset models are very closely tied to the Cesium architecture. Separating these Cesium assets from the CesiumWidgetView makes it easier to write new assets in the future, and keeps the CesiumWidgetView from becoming too expansive.
All three of these Cesium asset models have the common createCesiumModel() function, which constructs the appropriate cesiumModel for the type, given the cesiumOptions set on the model. The cesiumModel is then used by the CesiumWidgetView to render the data on the map. In addition, the type attribute used in each of these asset models directly corresponds to the Cesium constructor function that creates the cesiumModel .

Useful links
- CesiumJS on GitHub
- CesiumJS website - Overview of Cesium, including information about Cesium Ion
- Cesium documentation
- Cesium sandcastle - For experimenting with Cesium, includes helpful examples and demos
- TerriaJS on GitHub - a large application that also uses the CesiumWidget. Although Terria uses a customized and older version of Cesium, it can serve as a good reference.
- Planned features & known issues related to the Cesium Map in MetacatUI